Detect market phases
Separate exploratory periods from trend-like deterministic phases using a causal state machine.
Causal trading simulation – no real money at risk
Random Harvester® is a long-only trading simulation tool that scans price history left-to-right, detects trend-like phases, compares results against passive benchmarks, and separates part of realized gains into Banked Profit: cash the owner can treat as taken off the market-risk table.
Built for quantitatively curious investors, researchers, and educators who want to examine strategy behavior before committing capital.
What it helps you do
Random Harvester® is not a prediction machine and not a technical-analysis package. It is a research environment built around academic statistical analysis, testing whether phase-based rules behave sensibly under realistic constraints.
Separate exploratory periods from trend-like deterministic phases using a causal state machine.
Model a disciplined approach that enters long positions and holds cash during unfavorable conditions.
Suppress new buys and tighten stop-loss handling when the detected phase environment deteriorates.
Track the portion of realized gains converted into usable owner cash instead of leaving all wealth exposed to the next trade.
Read strategy results next to buy-and-hold and 60/40 benchmark behavior rather than in isolation.
Review signals, actions, cash, positions, banked profit, transaction costs, and comments step by step.
Produce self-documenting outputs with parameters, charts, trades, Banked Profit, drawdown, Sharpe, alpha, and commentary.
Method
Every decision is made with information available up to the current bar. The engine does not smooth the future into the past, and it does not revise earlier phases after seeing what happened next.
The price series is processed in chronological order, one pass only.
The detector moves between probing and deterministic regimes as evidence develops.
After profitable exits, the skimming rule can allocate excess cash into the Banked Profit track.
Results are evaluated with returns, Banked Profit yield, drawdown, trades, and benchmark-relative statistics.
Banked Profit
Most backtests focus on total equity alone. Random Harvester® also tracks Banked Profit: cumulative realized cash skimmed from profitable exits, not automatically reinvested into the next position, and therefore less exposed to the uncertain future path of the market.
Banked Profit makes the cash extracted from the strategy visible instead of folding everything into a single equity curve.
The banked portion is no longer assumed to be automatically committed to the next uncertain market phase.
Reports can show portfolio value and harvested cash together, so benchmark comparison is based on the owner's full outcome.
The overview combines per-ticker Banked Profit into a cumulative total, daily increment, and contributor list.
Daily banking events can show which tickers contributed to the cash harvested on that date.
Reports can include harvested cash, Banked Profit concentration, and Banked Profit yield alongside classic metrics.
Outputs
The strongest proof is the working trail left by each run: signals, portfolio state, benchmark context, and reportable metrics.
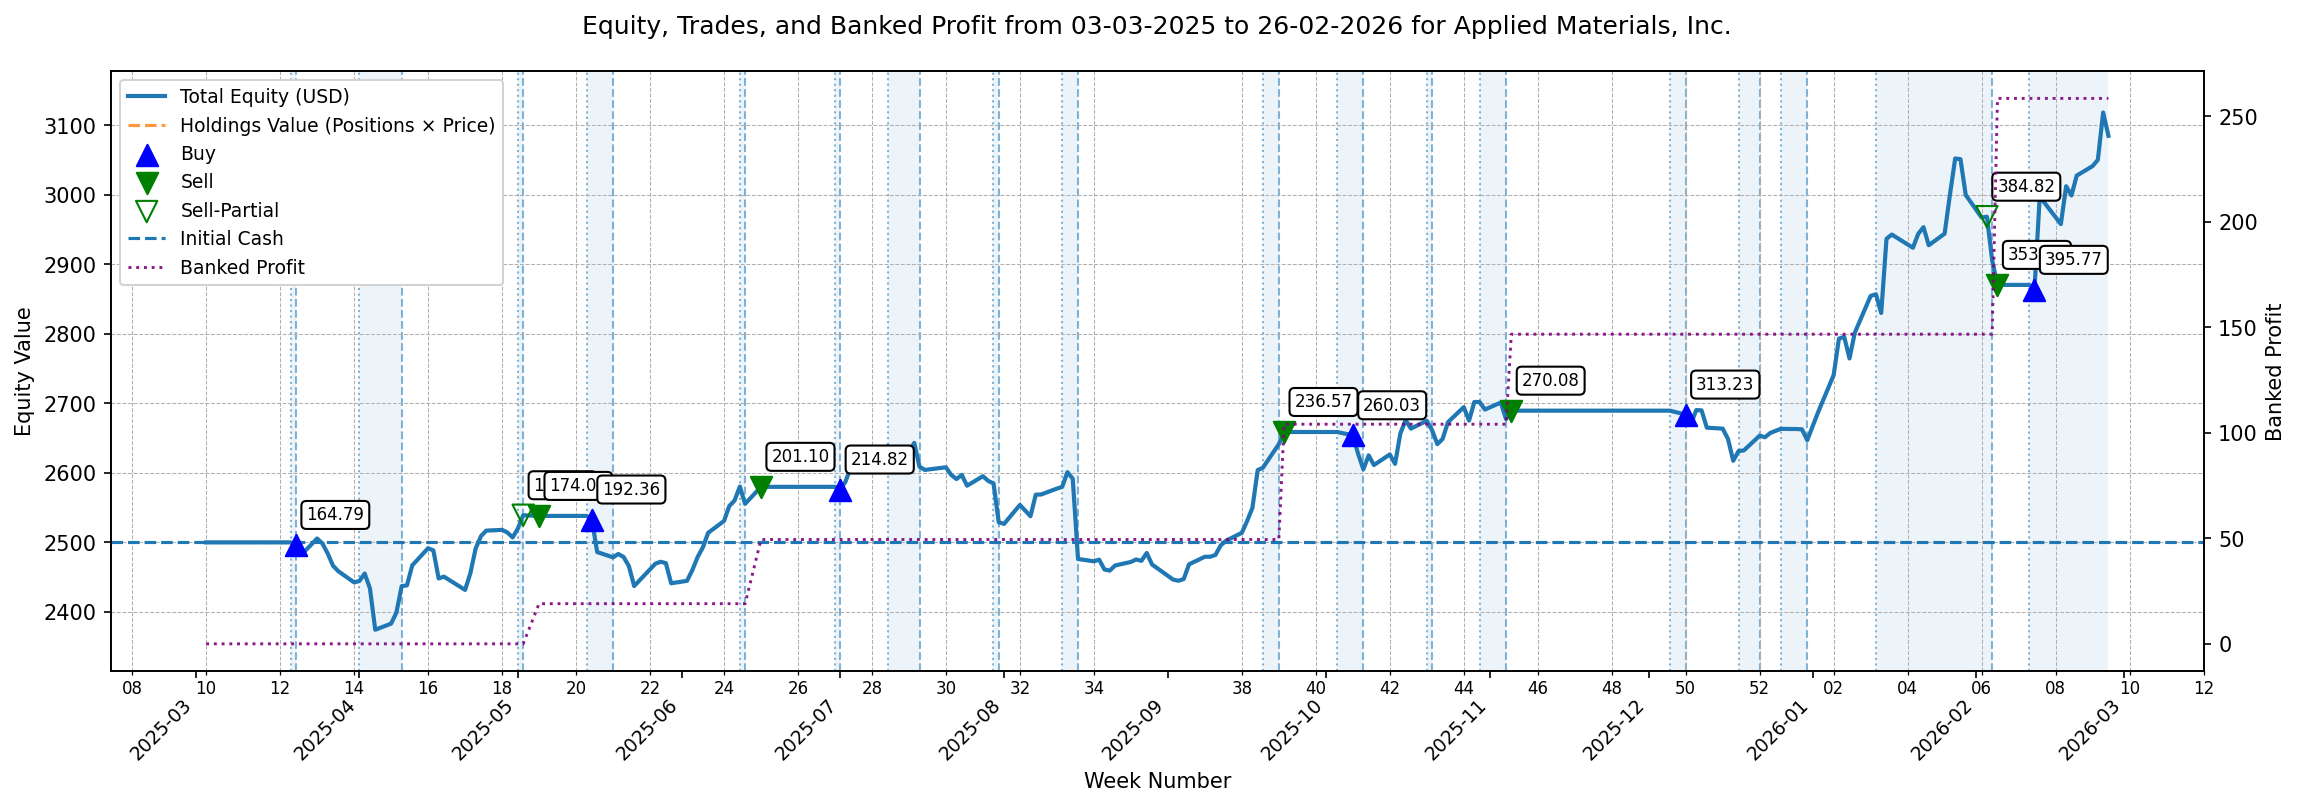
Price series with phase annotations, buy/sell markers, and bear-mode state.
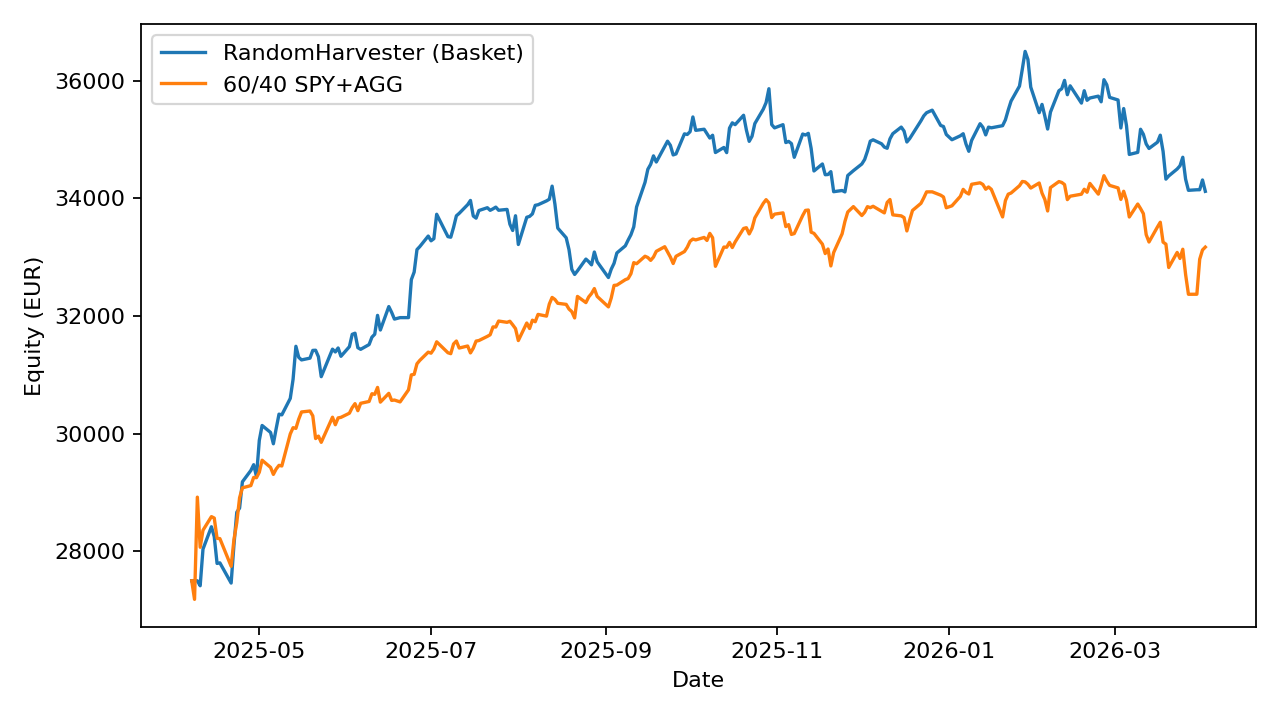
Strategy equity curve next to benchmark behavior and drawdown context.
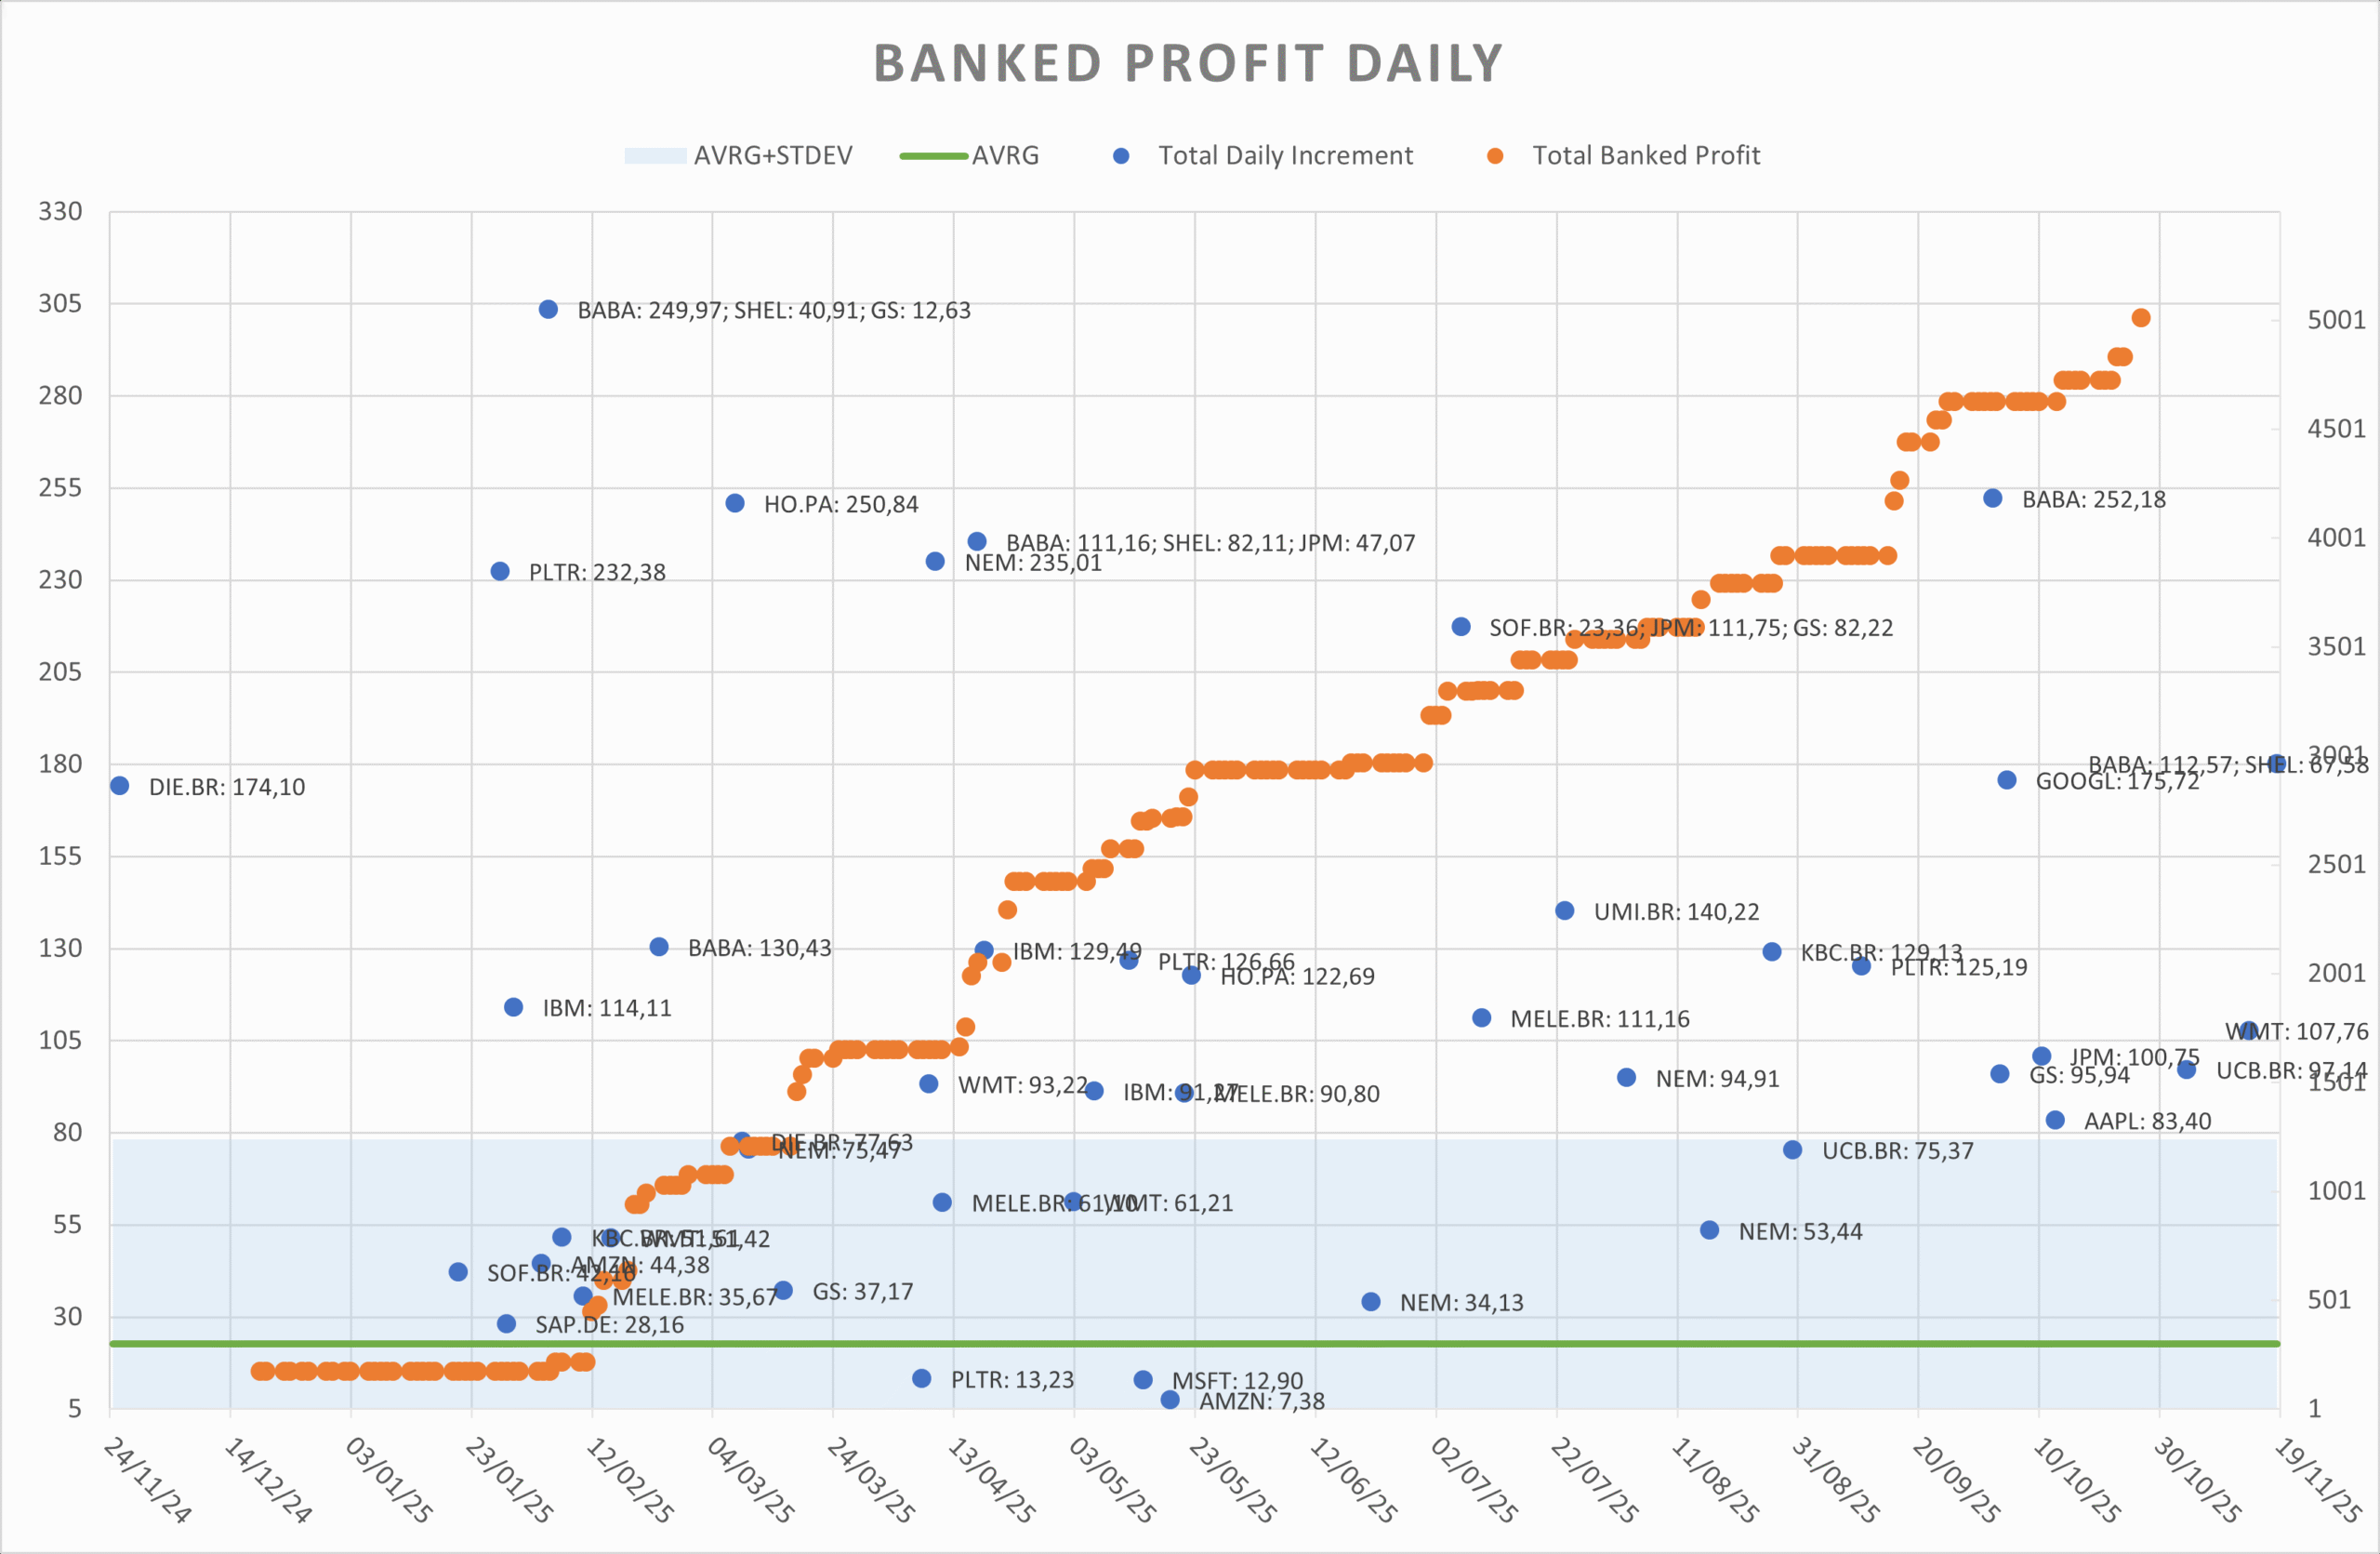
Dividend-like owner cash, daily increments, and the tickers contributing to each banking event.
Sharpe, alpha, max drawdown, trades, win rate, parameters, and generated commentary.
Evidence on request
I maintain benchmark test reports for both a long-term 2016-2025 window and a current one-year view on the same ticker universe. I do not intend to publish them as headline marketing material, but they are available on request for readers who want to inspect assumptions, benchmark comparison, Banked Profit behavior, and the simulated owner-wealth outcome in more detail.
Historical simulation over a 2016-2025 evaluation window, compared against a constant-mix 60/40 benchmark.
A more recent view on the same ticker universe, useful for seeing how the logic behaves in the latest market environment.
The reports include explicit backtest limitations, including parameter calibration, universe selection, fixed cost assumptions, and the need for out-of-sample validation.
Who it is for
Test ideas before putting money at risk and learn how a rule set behaves across different market conditions.
Use a visual front end for phase-based strategy experiments, portfolio inspection, and exportable results.
Demonstrate causality, drawdown, benchmarking, signal quality, and overfitting in a hands-on setting.
FAQ
No. It is currently best presented as research and simulation software. Optional IBKR-related modules exist, but the website should lead with simulation, not live execution.
No. The premise is to detect when recent market dynamics become more structured or trend-like, then step aside when that structure fails.
No. The method is better described as causal, phase-based statistical analysis rather than chart-pattern or indicator-driven technical analysis.
Not me. Order execution belongs with professional traders and professional execution infrastructure. The public website should be understood as describing research and simulation work.
No. The value is in transparent testing, benchmark comparison, and risk inspection, not in guarantees.
No. It is dividend-like from the owner's point of view, but it is generated by the strategy's realized exits rather than paid by the underlying company.
The desktop interface is intended to make the workflow inspectable, while the Python codebase remains accessible for deeper research and extension.
Demo
I am refining the tool and exploring conversations with investors, educators, and research partners who care about transparent strategy testing.
Request a demoDirect contact: eric.van.horenbeeck@randomharvester.com